
The 2027 K-12 Superintendent Turnover Report: What 745 Leadership Changes Mean for Your District Pipeline
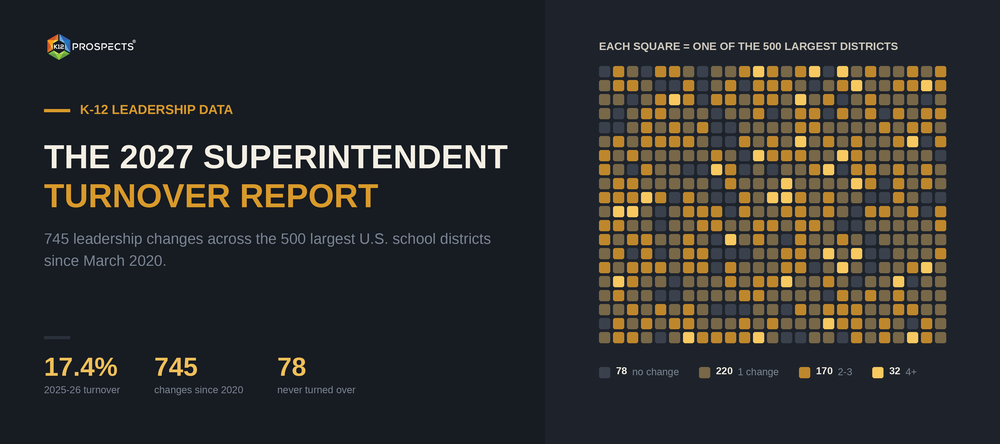
Eighty-seven of the nation’s 500 largest school districts changed superintendents between July 2025 and July 2026. At 17.4%, that is the lowest annual turnover rate recorded since before the pandemic, down from 23% the year before and 20% the year before that. Read on its own, the number looks like the end of a disruption story: fewer new bosses, fewer resets, more continuity for anyone selling into K-12. The number underneath it says something else entirely. Since March 13, 2020, those same 500 districts have changed superintendents 745 times, and only 78 of the leaders who were in their seats when buildings closed are still in them today.
For an EdTech or curriculum vendor, the gap between the annual rate and the cumulative churn is the entire story. A 17.4% turnover year is survivable. A six-year stretch in which the large majority of the country’s biggest districts have changed hands at least once, and 202 of them have changed hands twice or more, is a structural condition rather than a news cycle. It means the person who signed your contract is usually not the person who will decide whether to renew it, and the relationship you built in 2023 is often being evaluated in 2027 by someone who has never met you.
The Annual Rate Is Falling. The Cumulative Churn Is Not.
ILO Group’s Superintendent Research Project, published September 14, 2026, has tracked leadership in the 500 largest U.S. school districts since the start of the pandemic. Its latest findings put annual turnover back inside the pre-pandemic band of roughly 14% to 16%. Between July 2025 and July 2026, 87 of those districts experienced a leadership change, for a rate of 17.4%. The two prior years ran hotter: 23% of superintendents exited in 2024-25, and 20% left in 2023-24.
| Period | Turnover in the 500 largest districts | What it signaled |
|---|---|---|
| Pre-pandemic baseline | Roughly 14% to 16% | Normal churn; relationships aged predictably |
| 2023-24 | 20% | Post-pandemic exits still elevated |
| 2024-25 | 23% | Peak disruption in the tracked period |
| 2025-26 | 17.4% (87 districts, 94 total changes) | Return toward the pre-pandemic band |
The 94 total changes against 87 districts is not a rounding error. A handful of districts changed leadership more than once inside the same twelve months, which is the clearest signal in the dataset of where a vendor relationship is least durable. More encouraging for anyone trying to keep a contract alive through a transition: of those 94 changes, 53 of them, or 56%, handed the job directly to a permanent successor with no interim in between. Cleaner handoffs mean fewer months in which no one at the district has the authority to say yes to anything.
ILO Group co-founder and CEO Dr. Julia Rafal-Baer said in a September 14 statement that turnover “may finally be moving back toward pre-pandemic levels,” while noting that the pandemic’s mark on school system leadership remains unmistakable. Her point was not that leadership should never change, but that sustained progress needs enough time to move from a plan to implementation to results — and that when a transition does come, the district has to protect the work through the handoff.
That last clause is the one worth underlining, because protecting the work through the handoff is exactly what a vendor is asking a district to do when it asks a new superintendent to keep an inherited contract.
Where the Exits Cluster: Under Two Years and Over Six
The superintendents who left in 2025-26 were not spread evenly across the tenure curve. They fell into two groups at opposite ends of it: leaders with less than two years in the role, and veterans with six or more years under their belts. Mid-career exits, the three-to-five-year window that used to produce a steady trickle of departures, decreased. The middle of a superintendency has become the most stable part of it.
AASA’s 2025-26 Superintendent Salary & Benefits Study, released in March 2026 and drawn from roughly 1,951 superintendents across 49 states, fills in the other half of the picture. Average tenure in the current role now sits at 5.4 years, roughly double the three-years-or-less figure that got quoted for most of the last decade. And 88.88% of the superintendents surveyed said they intend to remain in their current district for the 2026-27 school year.
Put the two datasets side by side and the practical translation for a vendor is specific rather than vague. A district that just hired a new superintendent carries elevated risk for about twenty-four months, because that leader is both most likely to leave early and most likely to review everything they inherited. A district whose superintendent has passed the six-year mark carries a different kind of elevated risk: a long, stable, well-defended relationship that can end with a single retirement announcement. The years in between are where a multi-year contract is safest, and that is also where most of the top 500 now sit.
Example. A curriculum vendor holding eleven district contracts in the top 500 maps each one against its superintendent’s start date before building the 2027 renewal forecast. Three of the eleven have leaders inside their first two years, and two have leaders past year seven. The vendor does not treat those five as lost. It treats them as the five that need a named executive sponsor below the superintendent, a documented usage report, and a scheduled in-person review before the budget cycle opens, while the remaining six get a lighter touch. The forecast stays the same; the work behind it gets redistributed.
Three District Profiles, Three Different Renewal Motions
The most useful way to read six years of leadership data is not as a national average but as three distinct district populations, each of which should be sold to and serviced differently. The counts below are drawn from the same top-500 cohort, measured from March 13, 2020 to July 2026.
| Profile | How many of the top 500 | Leadership changes since March 2020 | What the vendor motion looks like |
|---|---|---|---|
| Anchored | 78 districts | None | Incumbency is worth real money. Long cycles, deep relationships, and a high bar for displacing whoever is already in the building. |
| Rotating | 202 districts | Two or more | Expect a reset every two to three years. Build the relationship below the superintendent, and keep proof of outcomes current and portable. |
| Chronic churn | 32 districts | Four or more | A subset of the rotating group. Treat the contract as perpetually up for review and never let the champion be a single person. |
The 78 anchored districts are the ones where a vendor that has already won is genuinely protected, and where a vendor that has not won faces the longest road. Nothing about the buying process there has been reset by a new leader in more than six years, which means the incumbent’s advantage has had six years to compound. Displacing an incumbent in an anchored district usually requires either a documented failure on their part or a budget event, not a better cold email.
The 202 rotating districts are where most K-12 revenue is actually won and lost, because a leadership change is the single most reliable moment at which an inherited vendor list gets opened. And the 32 chronic-churn districts, a subset of the rotating group that has been through four or more leadership changes since 2020, are the ones where institutional memory is thinnest. In those districts the strategic plan, the org chart, and the vendor roster have all been rewritten repeatedly, and the person most likely to remember why your product was purchased is a curriculum director or technology director, not the superintendent.
What Actually Happens to a Contract When the Superintendent Changes
A first-year superintendent reviews everything: the strategic plan, the org chart, the budget, and the contracts. Institutional inertia, which is the incumbent vendor’s single largest structural advantage, resets to zero at that moment. The tools that get cut first are the predictable ones, and they are worth naming because they are also the ones a vendor can do something about ahead of time: contracts with low documented usage, tools with no internal advocate, and products the previous superintendent personally championed. That last category is the cruelest, because being closely associated with the outgoing leader is a liability rather than a credential. The specific outreach sequence for reaching a newly seated leader is its own subject, and the new superintendent outreach playbook covers the timing and the first-touch language in detail.
The second thing that changes is quieter and often missed: approval authority. A new superintendent frequently arrives with, or soon hires, a new business official, and local approval limits get revisited during the first budget cycle. A purchase that cleared at the district level in 2025 can require board action in 2027 without the underlying state bid threshold moving at all, which is why the question of who signs the check and at what dollar amount has to be re-answered after every leadership change rather than assumed to carry over.
The third change is procedural. New leadership is a common trigger for a fresh vendor-approval or re-registration cycle, and a vendor that was on the approved list under the previous administration can find itself asked to re-document insurance, data-privacy terms, and references. Knowing how a district’s approved vendor list actually gets built makes that a scheduling exercise instead of an emergency.
Turning the Report Into a 2027 Territory Plan
The planning math is straightforward. If a vendor’s territory includes the top 500 districts, roughly 85 to 90 of them will change superintendents during any given year at the current rate, and around 56% of those will hand off cleanly to a permanent successor. That is not a forecast of doom; it is a predictable annual volume that can be staffed and sequenced like anything else. What separates the vendors who convert leadership changes into pipeline from the ones who lose accounts to them is whether the leadership data lives on the contact record.
In practice that means three fields most K-12 prospect lists do not carry: the superintendent’s name, their start date in that seat, and whether the seat is currently filled on a permanent or interim basis. Enrollment tier tells a vendor how the district buys. Leadership tenure tells them when it will be re-decided. This is the kind of role- and district-level data K12 Prospects maintains, and a verified contact without a start date attached is a contact a vendor cannot time.
Example. An assessment vendor rebuilds its 2027 account plan around the leadership field instead of the renewal date. Forty-one districts in its book sit in the top 500; eight of them changed superintendents during the 2025-26 cycle. Rather than treating all eight as renewal risk, the vendor separates them: five have a curriculum director who has been in place through the transition and can vouch for usage, and three do not. The three without a surviving champion get an in-person outcomes review scheduled before December. Two of those three renew, one does not, and the one that does not is lost to a consolidation decision that would have happened regardless. The difference from the prior year is that none of the eight came as a surprise in Q4.
One More Number Worth Tracking: Who Is Getting the Job
Women now hold 34% of superintendencies in the top 500 districts, up from 33.2% a year earlier, and the count has grown or held steady every year since 2020. At the state level, 27 of the 51 chief state school officers are women. Progress is real but slow: at the current pace, parity in the top 500 superintendent roles is roughly twenty-two years out, which puts it around 2048.
The reason a sales team should track this alongside the turnover numbers is practical rather than ceremonial. One in three of the largest districts in the country is now led by a woman, and outreach that still defaults to assumptions about who is in the chair reads as exactly what it is: a template that was written for a different decade and never updated. Verifying the name, the title, and the start date before the first touch is the same discipline that makes the rest of this report actionable.
The Short Version
Annual superintendent turnover has come back down to something close to normal, and that is genuinely good news for continuity. But six years of accumulated churn have left most of the country’s largest districts under leadership that did not select the vendors it inherited. For 2027 planning, the number to act on is not 17.4%. It is 745 leadership changes across 500 districts since March 2020, 202 districts that have turned over at least twice, and 78 that have not turned over at all. Those three populations do not buy the same way, do not renew the same way, and should not receive the same campaign.